Home » Data Analysis and Statistics At-A-Glance Home » Data Analysis and Statistics At-A-Glance
Key Statistics Terms
- Statistical procedures used to summarise, organise, and simplify data.
- Population: An entire collection of data.
- Scores : Each collection of data
- Total scores: N is the total number of scores of population
- Sample: A subset of population.
- Random: Chosen in a way to allow each member of the population an equal chance of being selected.
- Response Rate: The proportion of people who respond to a survey.
Key Formulas
- Mean,

- Midrange

- Range = cHighest - cLowest
- Mode =Value in the set occurs most often.
- Median= puthe values in oder, then find the middle
- Population Variance,

- Sample Variance,

- Population,

- Standard deviation,

- Probablity,

- Conditional Probability, P(B|A) = P(A and B) / P(A)
- Central Limit Theorem,

- Uniform probability fn, f(x) = 1/(b - a),for for a < x < b
- = 0 , elsewhere
- Expected value of x, E(x) = (a + b)/2
- Variance of x, Var(x) = (b - a)2/12
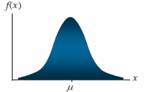
- Normal Probability Density Fn,

- Expon. Prob. Density,
 for x > 0, m > 0 for x > 0, m > 0
Variables Used
- N=Number of scores
- μ=mean
 = 3.14.. = 3.14..
 =2.718 =2.718
- a=smallest value a variable can assume
- b=largest value a variable can assume
- E=events
Measures
- Measures of Central tendency are are measures of the location of the middle or the center of a distribution- (Mean, Median, Mode, Mid-range).
- Measures of Variability describes in an exact quantitative measure, how spread out/clustered together the scores are-(Range, Variance, Standard deviation).
Probability
- A probability provides a quantitative description of the likely
- Occurrence of a particular event.
- Randon Variable associates a unique numerical value with every outcome of an experiment (Discrete, Continous)
- Magnitude along X axis and frequency of score along Y axis
- Categorical, Histogram, Bar Charts, Frequency Polygon, Stem-and-leaf plot
The data supports the claim or not.
Null Hypothesis – Statement of no effect.
Alternative Hypothesis – Statement suspect is true.
Type I error is rejecting the null hypothesis when it is true
Type II error is not rejecting the null hypothesis when it is false.
Limit Theorem
As the sample size increases the sampling distribution of the sample mean approaches the normal distribution with mean m and variance s2/n.
A continuous random variable can assume any value in an interval on the real line or in a collection of intervals- Uniform, Normal, Exponential.
Statistics Problem Solving Tips
- Think statistically and trty to apply in day to day life.
- Setting up each segments of the problem
- rather than memorize the formula, think about how to derive the formula and identify its parts
- Try step by step approach
- Draw a diagram if needed.
- Identify all given information.
- Select appropriate formula(s) that incorporate what you know and what you want to find.
Typical Problem
Example: A random sample of 100 recorded deaths in the United States during the past year showed an average life span of 71.8 years, with a standard deviation of 8.9 years. Does this seem to indimate that an average life span today is greater than 70 years? Use a 0.05 level of significance.
H0:  =70 =70
Ha:  >70 >70
 =0.05 =0.05
Critical Region: z>1.645
Computation:  =71.8, =71.8,  years, n = 100 and years, n = 100 and
Z= =2.02 =2.02
Conclusion: Reject H0 and conclude that the average life-span today is greater than 70 years
How to Use
How to Use This Cheat Sheet: These are the keys related this topic. Try to read through it carefully twice then recite it out on a blank sheet of paper. Review it again before the exams.
Would you like to study the entire math course in 24 hours? Master all important concepts and learn how to solve problems. Super review your upcoming exams with our cheat sheets. Get started with out rapid courses now!
Calculus
Introductory Statistics
To quickly learn about our math rapid learning system, view the movie:
|